Santa Clause Rally: Have we been Naughty or Nice?
OVERVIEW
The Santa Claus Rally is a historical stock market phenomenon observed during the final five trading days of December and the first two trading days of January. Historically, markets rise during this period in approximately 73%-80% of years, driven by holiday optimism, lighter trading volumes, and portfolio rebalancing.
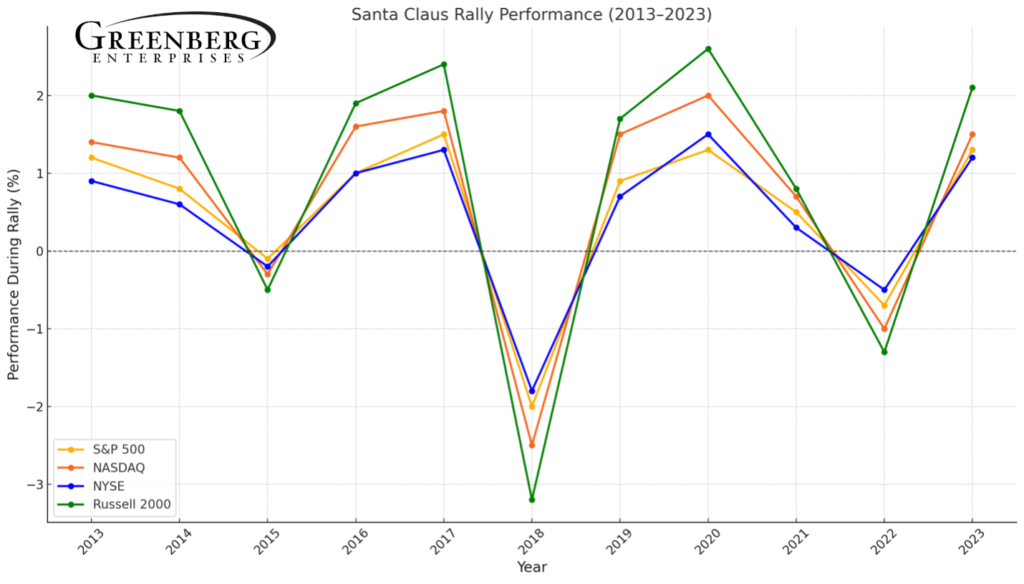
This report reviews historical trends and includes performance data for the S&P 500, NASDAQ, NYSE, and Russell 2000 (a benchmark for small-cap stocks).
Historical Santa Claus Rally Performance (2013–2023)


FACTORS INFLUENCING SANTA CLAUS RALLY PERFORMANCE
Tax-Loss Harvesting:
- Investors sell underperforming assets earlier in December for tax purposes.
- This creates downward pressure, particularly on small-cap stocks like those in the Russell 2000.
Portfolio Rebalancing:
- Fund managers adjust allocations for year-end reporting, often increasing exposure to small-cap and growth stocks.
Holiday Optimism and Reduced Volume:
- Lower trading volumes amplify price movements.
- Holiday sentiment often drives positive momentum in equities.
Federal Reserve and Economic Reports:
- December’s mid-month Fed meetings and year-end economic data releases (e.g., employment reports) can cause volatility before the rally period.
KEY OBSERVATIONS
December Volatility:
- Early December often sees moderate volatility due to tax-loss harvesting and rebalancing.
- Late December stabilizes as optimism and lighter trading volumes create a favorable environment.
Small-Cap Strength:
- The Russell 2000 has consistently performed well in rally years, often outpacing larger indices.
Outlier Years:
- 2018 saw sharp declines across all indices due to significant market corrections and policy uncertainty.
ADDITIONAL READING:
https://www.emerald.com/insight/content/doi/10.1108/mf-10-2015-0280/full/html
